Periodic regression model#
In progress
[1]:
import matplotlib.pyplot as plt
import numpy as np
import pandas as pd
[2]:
from pysip.regressors import Regressor
from pysip.statespace import Periodic
[3]:
# Generate artificial periodic data
np.random.seed(1)
xlim = (0, 7)
alim = (1, 3)
n = 20
period = 1
t = np.sort(xlim[0] + (xlim[1] - xlim[0]) * np.random.random(n))
amplitude = alim[0] + (alim[1] - alim[0]) * np.random.random()
noise = 0.2 * np.random.randn(n)
y = amplitude * np.sin(2.0 * np.pi / period * t) + noise
y[y <= 0] = 0.0
data = pd.DataFrame(index=t, data=y, columns=["y"])
[4]:
# Parameter settings for the Periodic covariance function
parameters = [
    dict(name="period", value=1.0, transform="fixed"),
    dict(name="mscale", value=1.0, transform="log"),
    dict(name="lscale", value=1.0, transform="log"),
    dict(name="sigv", value=0.1, transform="log"),
]
[5]:
# Instantiate regressor with the Periodic covariance function
reg = Regressor(Periodic(parameters), outputs="y")
[6]:
fit_summary, corr_matrix, opt_summary = reg.fit(df=data)
fit_summary
Optimization terminated successfully.
         Current function value: 4.983631
         Iterations: 10
         Function evaluations: 84
         Gradient evaluations: 12
[6]:
| θ | σ(θ) | pvalue | |g(η)| | |dpen(θ)| | |
|---|---|---|---|---|---|
| mscale | 1.713481 | 0.977867 | 0.097745 | 0.000018 | 3.405976e-17 |
| lscale | 1.635237 | 0.642892 | 0.020986 | 0.000038 | 3.739717e-17 |
| sigv | 0.159970 | 0.030951 | 0.000077 | 0.000044 | 3.907706e-15 |
[7]:
# Predict on test data
tnew = np.linspace(xlim[0], xlim[1] + 1, 500)
ds = reg.predict(df=data, tnew=tnew, smooth=True)
ym = ds.y_mean.to_dataset("outputs").y
ystd = ds.y_std.to_dataset("outputs").y
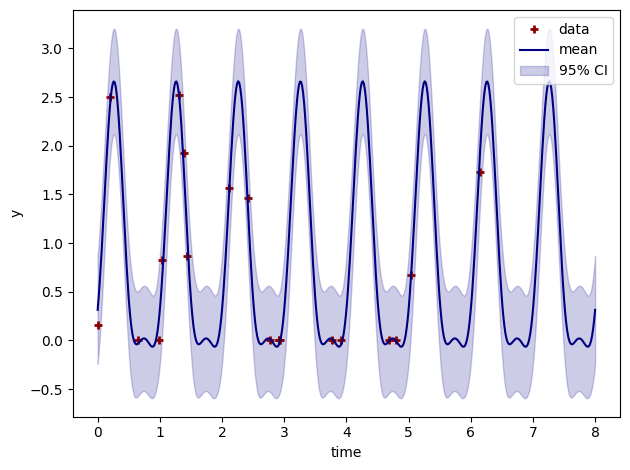
[8]:
# Plot output mean and 95% credible intervals
plt.plot(t, y, linestyle="", marker="+", mew=2, label="data", color="darkred")
ym.plot(color="navy", label="mean")
plt.fill_between(
    ym.time,
    ym - 2 * ystd,
    ym + 2 * ystd,
    color="darkblue",
    alpha=0.2,
    label=r"95% CI",
)
plt.tight_layout()
plt.legend()
[8]:
<matplotlib.legend.Legend at 0x7f1c83606650>